
Some interesting oil industry statistics - production
©1997-2009 Gibson Consulting

 | By Richard Gibson:
What Things Are Made Of
The story of America's dependency
on mineral commodities (including oil) in everyday life.
Buy the book. Print (312 pages): $17.95; electronic (PDF) $9.99. Additional e-versions details to come.
visit the blog | Share this article
|
Support this page! |
 WORLD PRODUCTION/CONSUMPTION: Production in 2004 averaged about 83.02 million barrels per day, about equal to the world consumption at 82.46 million barrels per day in 2004 (up from about 74 millon b/d in 2002) Source. Consumption is increasing at a faster rate than the increase in production. And at the end of 2005, World demand was expected to exceed world refinery capacity for the first time - demand of 84 million barrels per day vs 83.5 million barrels per day refinery capacity.
USA
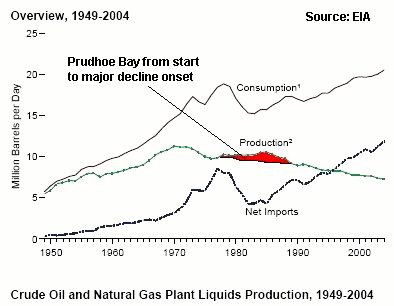 Gulf of Mexico wells and production - May 2010 • US PRODUCTION, early 2002: About 5.9 million barrels of oil per day, plus about 2 million barrels of natural gas liquids and condensate; and 55 billion cubic feet of gas per day. Oil production is a decline from 8-9 million b/d in 1986.Update, 2005: at the end of 2005, US crude oil production stood at 4.86 million b/d, the lowest value in more than 50 years. Imports (10.01 million b/d) amounted to 67% of consumption. As shown in the figure at left, even when US production was at its peak in 1970 (and accounted for more than 40% of all the oil produced in the world), it could not keep up with consumption. Today's 21 million barrels per day consumption FAR outpaces our domestic production of 4.86 million barrels per day. Prudhoe Bay's contribution is shown in red. US oil consumption exceeds the total of the next 5 largest consumers - China, Japan, Russia, Germany, and India COMBINED. Source • From 1990 to 2007, US production decreased by 31% at the same time as consumption increased by 24%.
World's other largest producers:
Former USSR (once the world's largest producer) production has declined
more than 30% since 1988, from more than 12 to about 8 million barrels per day.
In the early 2000s, production in Russia is recovering, and new production in
Kazakhstan is coming onstream. Saudi Arabia produces
about 5 to 9 million barrels per day (7.3 million in early 2002; production depends
more on OPEC quotas and prices than on real capability).
US crude-oil production capacity, about 5 million barrels per day, is accomplished with about 510,000 oil wells, averaging 10.5 barrels per well per day. (That's more than half of all the producing oil wells in the world. The country with the most wells, after the US, is Russia at about 110,000; then China with around 80,000, and Canada with 68,000. World total producing oil wells is about 880,000.) Saudi capacity, at about 8-9 million barrels per day, is from 1500 wells — averaging more than 5,000 barrels per well per day. The best well in the onshore 48 states for many years was in Grant Canyon Field, Nevada, producing about 4000 barrels per day from sucrosic Devonian dolomites in a small fault block. UPDATE: 1997 discoveries in the Williston Basin are producing up to 6,000 barrels per day from Mississippian Lodgepole carbonate mounds. These are the best wells in the onshore 48 states in decades -- but the Gulf of Mexico is the US hot spot for current exploration and production. THE FACT THAT THE US ALREADY HAS 510,000 wells is just one reason why we cannot simply "drill more wells" to achieve a fictional energy independence, as many Americans naively suggest. Most of the oil in the US has already been found and produced - the peak of US oil production happened in 1970, and it can NOT be achieved again.
US Petroleum Consumption and
Production changes
(data from EIA) |
| Year | Consumption change from previous | Production change from previous |
| 1990 | | |
| 2001 | +16% | -22% |
| 2002 | +0.6% | -0.8% |
| 2003 | +1.4% | -1.3% |
| 2004 | +3.5% | -4.6% |
| 2005 | +0.6% | -4.4% |
| 2006 | -0.5% | -1.5% |
2007
(9 mo.) | +.05% | -0.05 |
| 2008 | | |
In the U.S., about 35% of oil and gas production comes from reservoirs of Tertiary age (largely in the Gulf Coast and California); about 25% is from reservoirs of Pennsylvanian age (West Texas, Rockies, Midcontinent), and about 12% is from reservoirs of Cretaceous age. Sandstone reservoirs account for 70% of fields; limestone = 16%; dolomite = 11%.
Gulf of Mexico wells and production - May 2010 • The Offshore US Gulf of Mexico has become one of the "hottest" exploration areas in the world, just a few years after many had declared it the "Dead Sea" for exploration potential. Dramatic improvements in 3-D Seismic technology (increasing success rates to as much as 80%, up from less than 40%) and deepwater drilling methodology are largely the basis for this resurgence. And several very nice discoveries have not hurt one bit. Reserves in discovered deep-water (>500 meters) fields alone are estimated at nearly 1.5 billion barrels, with two fields (Shell's Mars and BP's Crazy Horse, renamed Thunder Horse) at about 100,000,000 barrels or more. Where does oil enter the US? (external link)
Leading Oil Producing States
(barrels/day in 2005 and % change from 2004) |
Louisiana: 1,463,000 -1.6%
Texas: 1,331,000 -6.7%
Alaska: 894,000 -5.1%
California: 723,000 -2.0%
Oklahoma: 177,000 0.0%
New Mexico: 171,000 -4.5%
Wyoming: 144,000 +2.1%
North Dakota: 91,000 +12.3%
Kansas: 88,000 -5.4%
Montana: 73,000 +14.1%
|
The top ten producing states by current daily production are given in the table at left. Illinois is not a present-day big producer, but until about 1970, Illinois was the 4th largest cumulative producer of oil (after TX, LA, and OK). The dramatic percentage increases in North Dakota and Montana reflect very active exploration and new discoveries in the Williston Basin, which will likely push these two states to significantly higher levels of production within a few years.
Compiled by Dick Gibson, Gibson Consulting, 301 N. Crystal St., Butte, MT 59701
Want to know more?
Gibson Consulting recommends: Read The Prize, by Daniel Yergin. |

©1997-2009 Gibson Consulting
Background image of drilling well in Utah in 1981 © 2000 by Dick Gibson